AE 424 Fall 2021 Group 5 Final Project: Thin Airfoil Theory#
TAT: Summary#
This report aims to compare analysis methods for airfoils. By selecting “Airfoil A” from the problem statement, analysis was performed using thin airfoil theory and an open source program called JavaFoil. The results of our analysis are then compared to experimental measurements and the resulting error is discussed. Thin airfoil theory and JavaFoil are found to have similar results, while experimental data strays from analysis trends.
TAT: Nomenclature#
TAT: Introduction#
Thin Airfoil Theory (TAT) as described in AE 424 is the mathematical analysis of airfoil properties wherein the airfoil is represented by a vortex sheet placed on the mean camber line of the airfoil. Given four airfoils, this group decided to analyze “Airfoil A” with the given properties. This report attempts to compare analysis methods for airfoils. These methods are experimental measurements, JavaFoil, and TAT.
TAT: Procedure#
TAT: Experimental Data#
TAT: JavaFoil Configuration#


TAT: MATLAB Code#
TAT: Results and Data#
This section contains the data from the analysis methods utilizing the tools above.
TAT: Experimental Givens#
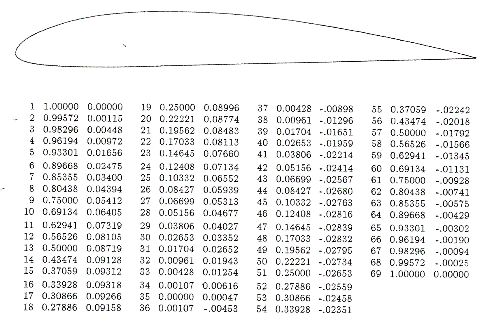
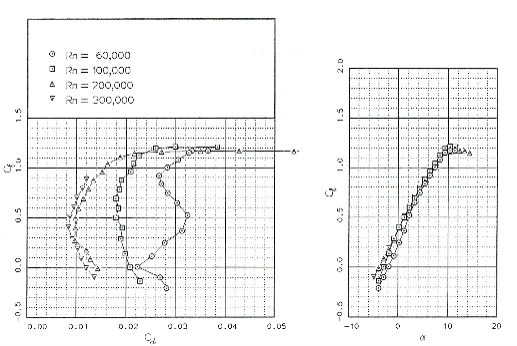
Refer to Experimental Data for Airfoil A data.
TAT: Thin Airfoil Theory Analysis#
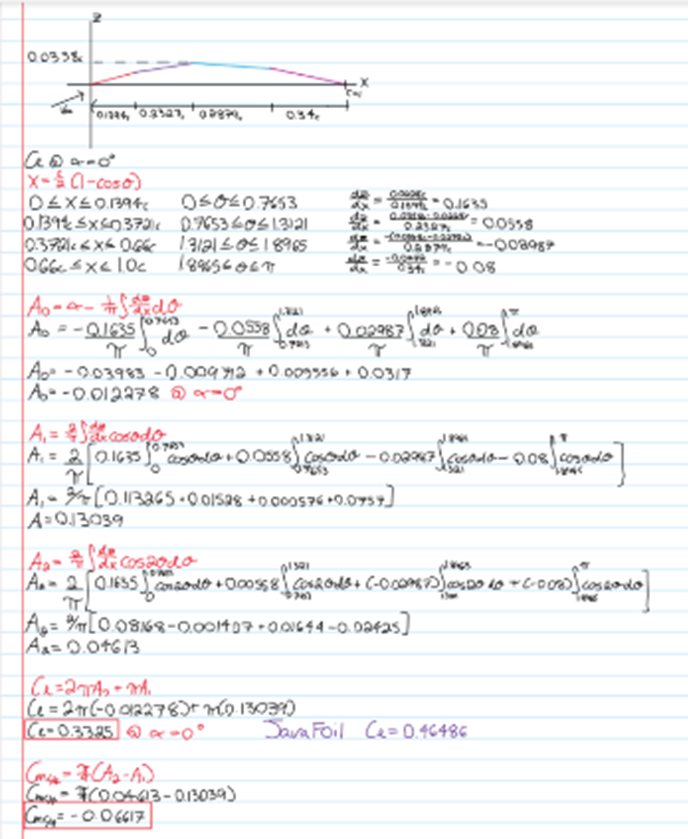
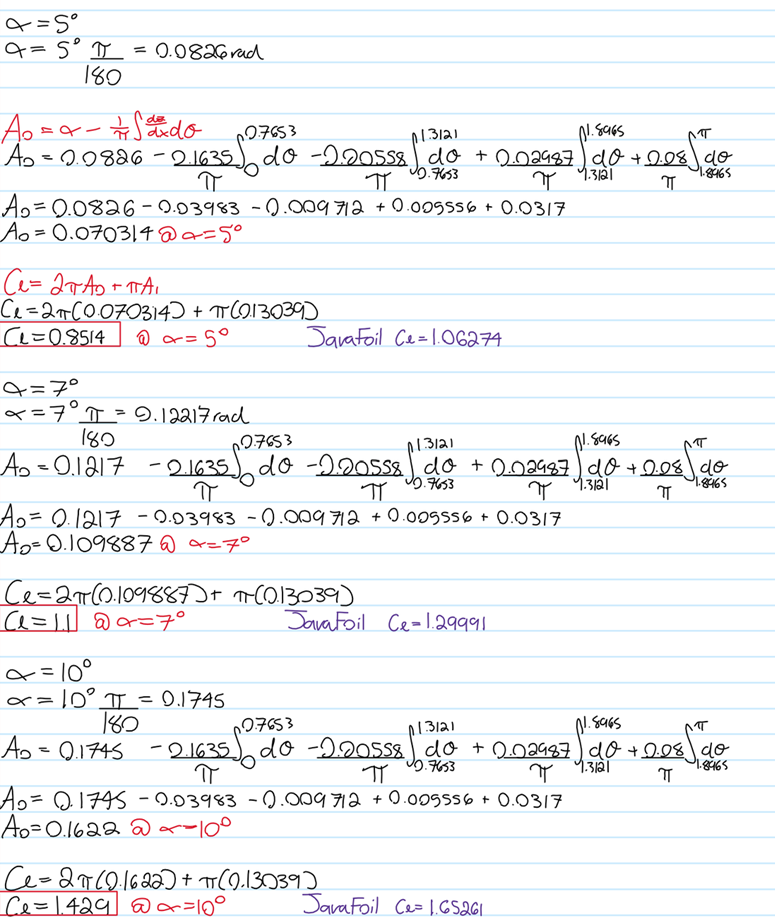
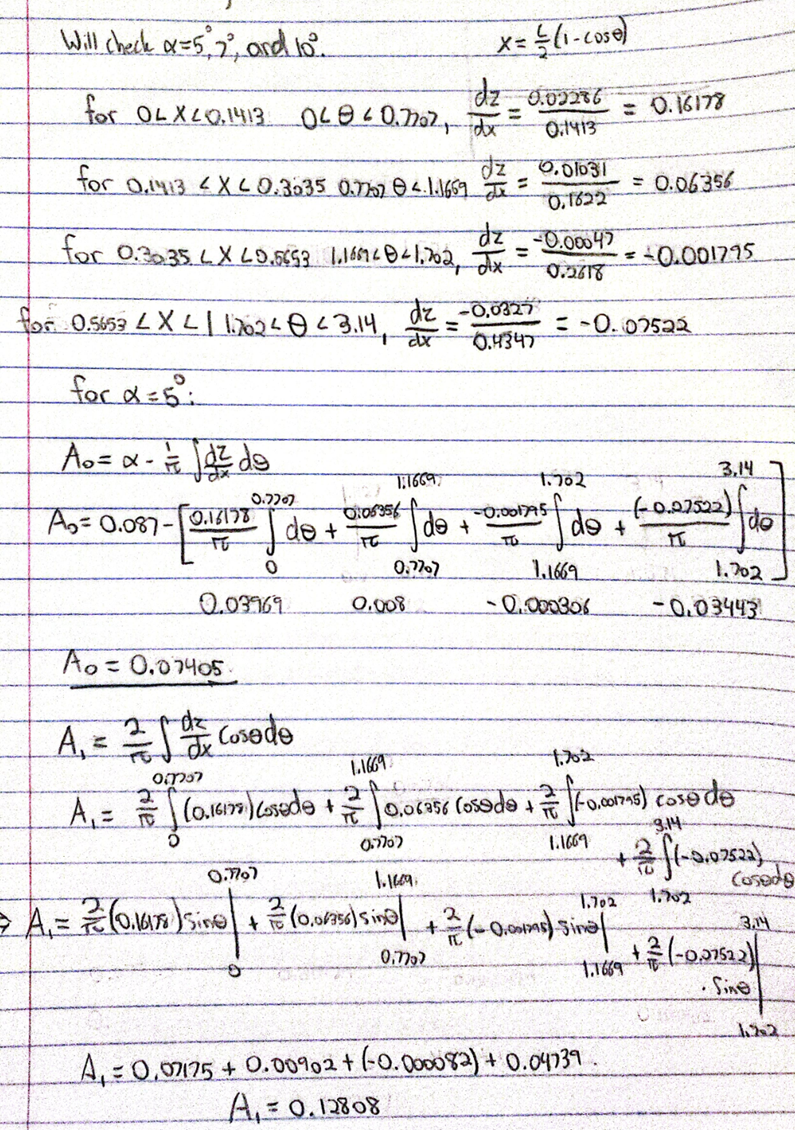
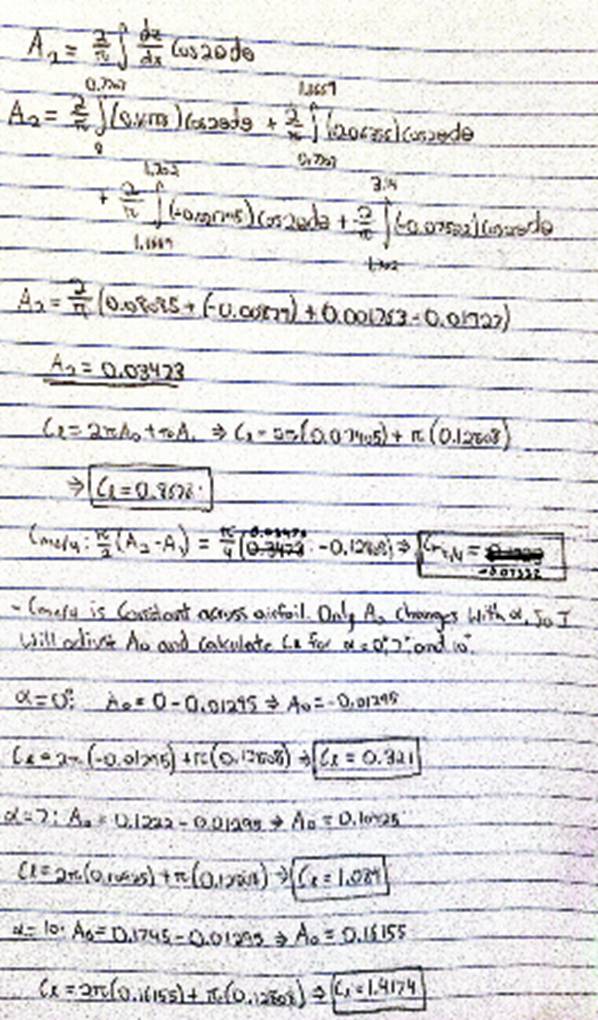
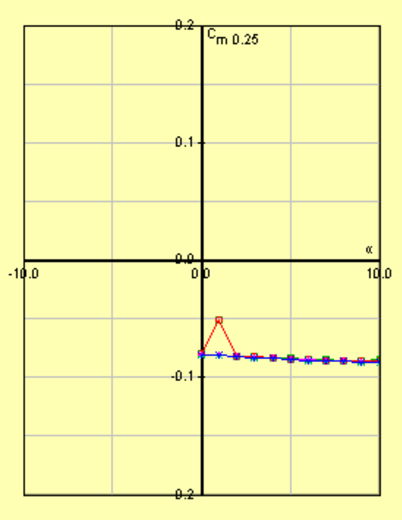
An important note about Thin Airfoil Theory calculations to consider is that the coefficient of the moment about the quarter chord (\(c_{m,\frac{c}{4}}\)) is not a function of \(\alpha\). Based on written calculations, repectively, \(c_{m,\frac{c}{4}} = -0.066178\) or \(-0.07332\) always.
TAT: JavaFoil Analysis#
\(c_l - c_d\) Curves
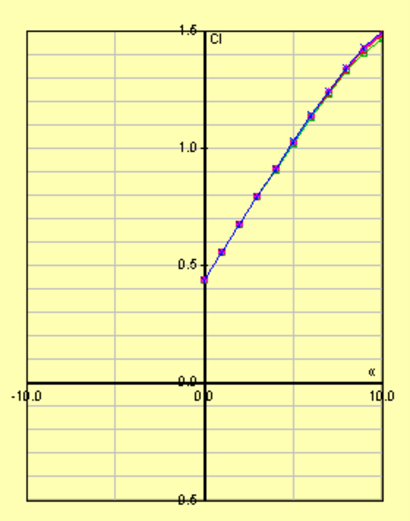
\(c_l - \alpha\) Curves
\(c_m - \alpha\) Curves
\(c_p\) Curve at \(\alpha = 30°\)

Using a trapezoidal approximation of the integral:
TAT: MATLAB Analysis#
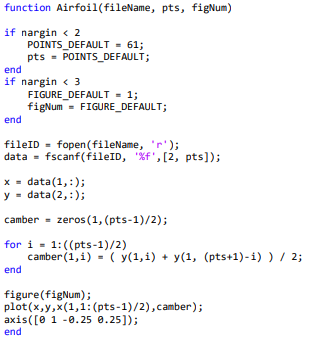
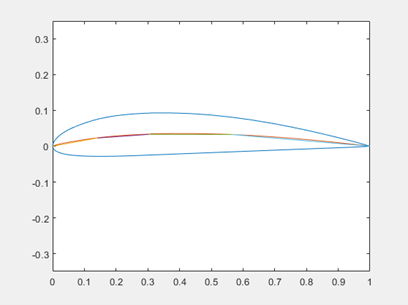
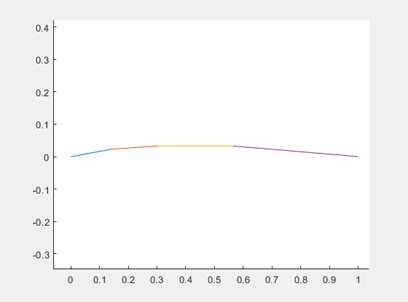
This section contains the results of the MATLAB code polynomial fit.
TAT: Discussion of Differences#
TAT: Visual Comparison of Results#
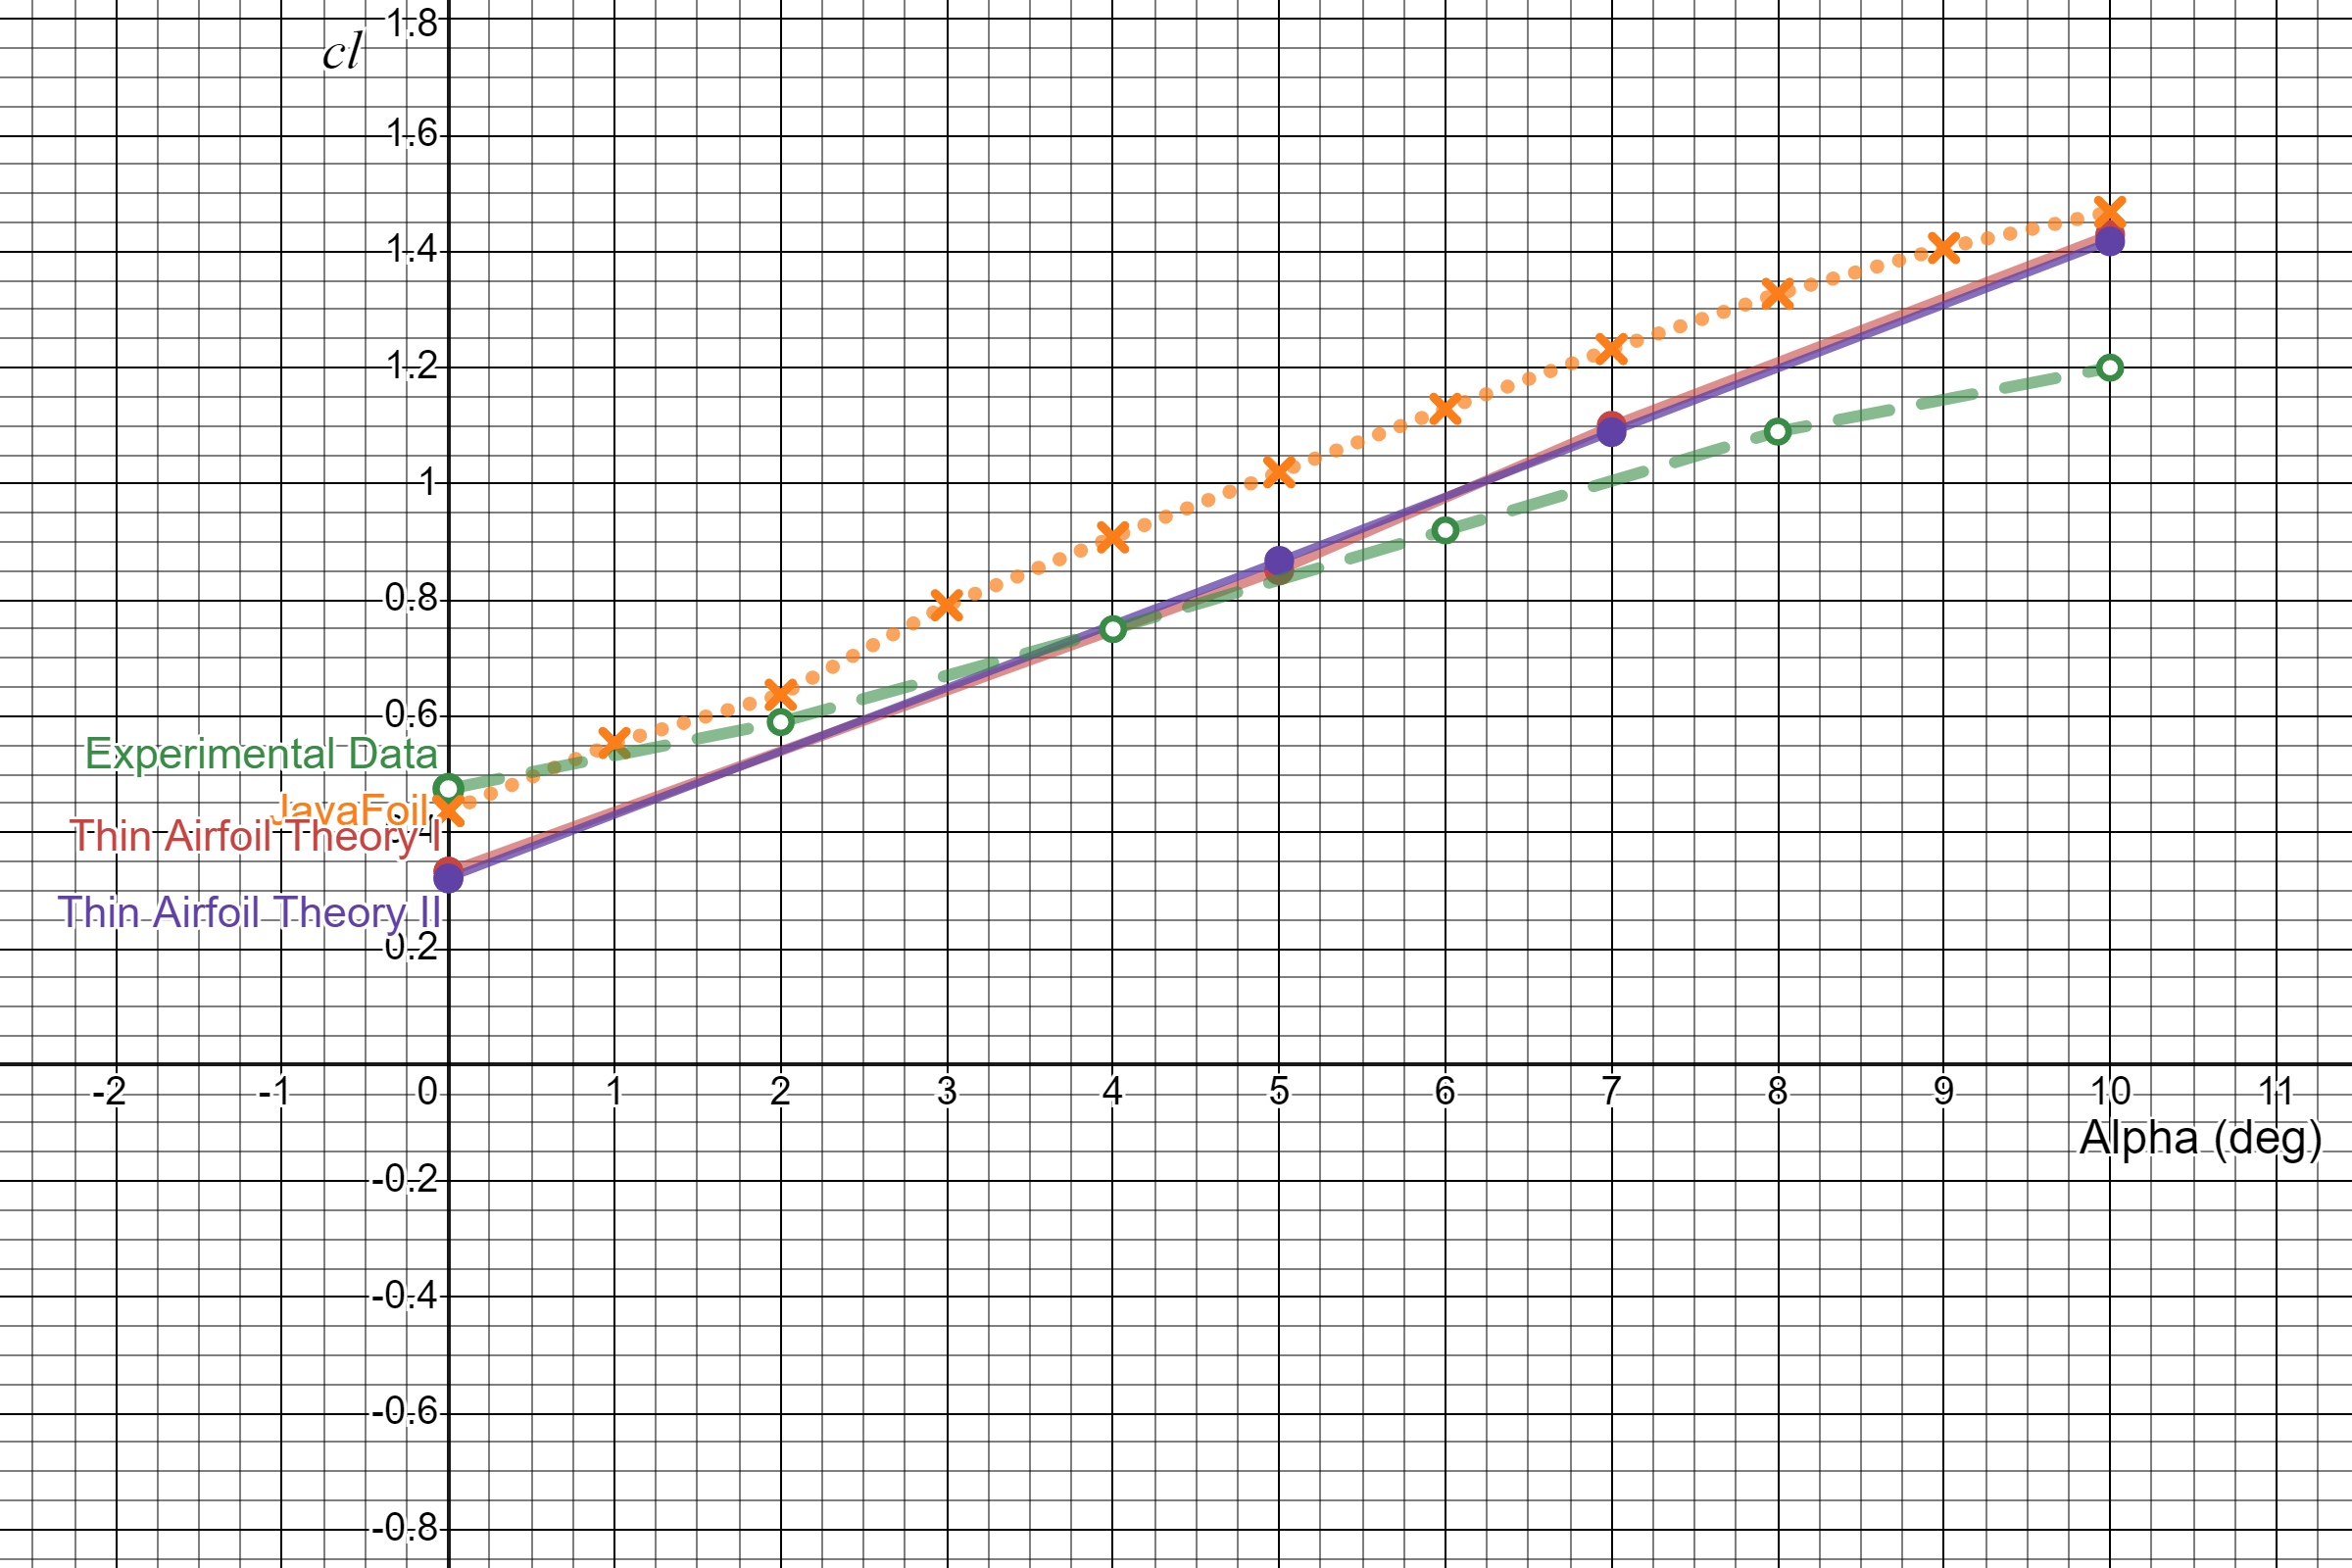
TAT: Discussion#
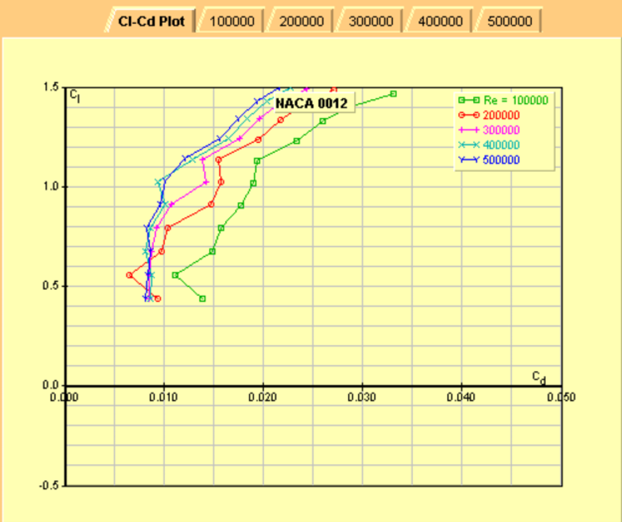
As \(\alpha\) from 0° to 10°, the value of \(c_l\) is dependent on the method of analysis. Experimental data is likely from extensive wind tunnel testing and an accurate representation of actual \(c_l\) values. Error may be found in the reading of the plots, but the values are given to the group. JavaFoil data for \(R_e = 1e6\) are plotted in the figure. JavaFoil has error associated with computational methods inside of the program and in choice of \(R_e\), but compared to higher \(R_e\), the values remain within 0.01 of values in the figure. Thin Airfoil Theory results follow the trend of JavaFoil more closely than that of the experimental data, but also represents a smaller data set.
The differences between analysis method can be found entirely withint the error associated with the approximations and assumptions made. Thin Airfoil Theory does not consider \(R_e\), whereas JavaFoil does. Experimental data contains the effects of frictional forces, whereas TAT assumes inviscid flow: helping to explain the trend of decreasing \(\frac{\partial c_l}{\partial\alpha}\) in the experimental data. It should also be noted that the experimental data nears stall as it approaches \(\alpha = 10°\), further describing the decline.
TAT: References#
“Desmos Graphing Calculator,” Desmos, Inc, 2021.
Hepperle, M., “JavaFoil,” MH Aero Tools, 2018.
“MATLAB R2021b - for student use,” MathWorks, 2021.
